Nanomatch Mobility Calculator
Properties |
Notes |
|---|---|
byproduct |
|
Dipole (property not yet described / available) |
byproduct |
byproduct |
|
recommended |
Workflow
The Nanomatch Mobility Calculator is a multiscale simulations workflow designed to calculate the charge carrier mobility of organic semiconductors starting from the first-principles. The workflow progresses from the single molecular structure through atomic and electronic properties to the macroscopic hole and electron mobilities, ensuring an efficient and comprehensive computational protocol.
The brief overview is given in the table below.
Nanomatch Software |
Scientific Role |
Illustration |
|---|---|---|
Geometry optimization
|

|
|
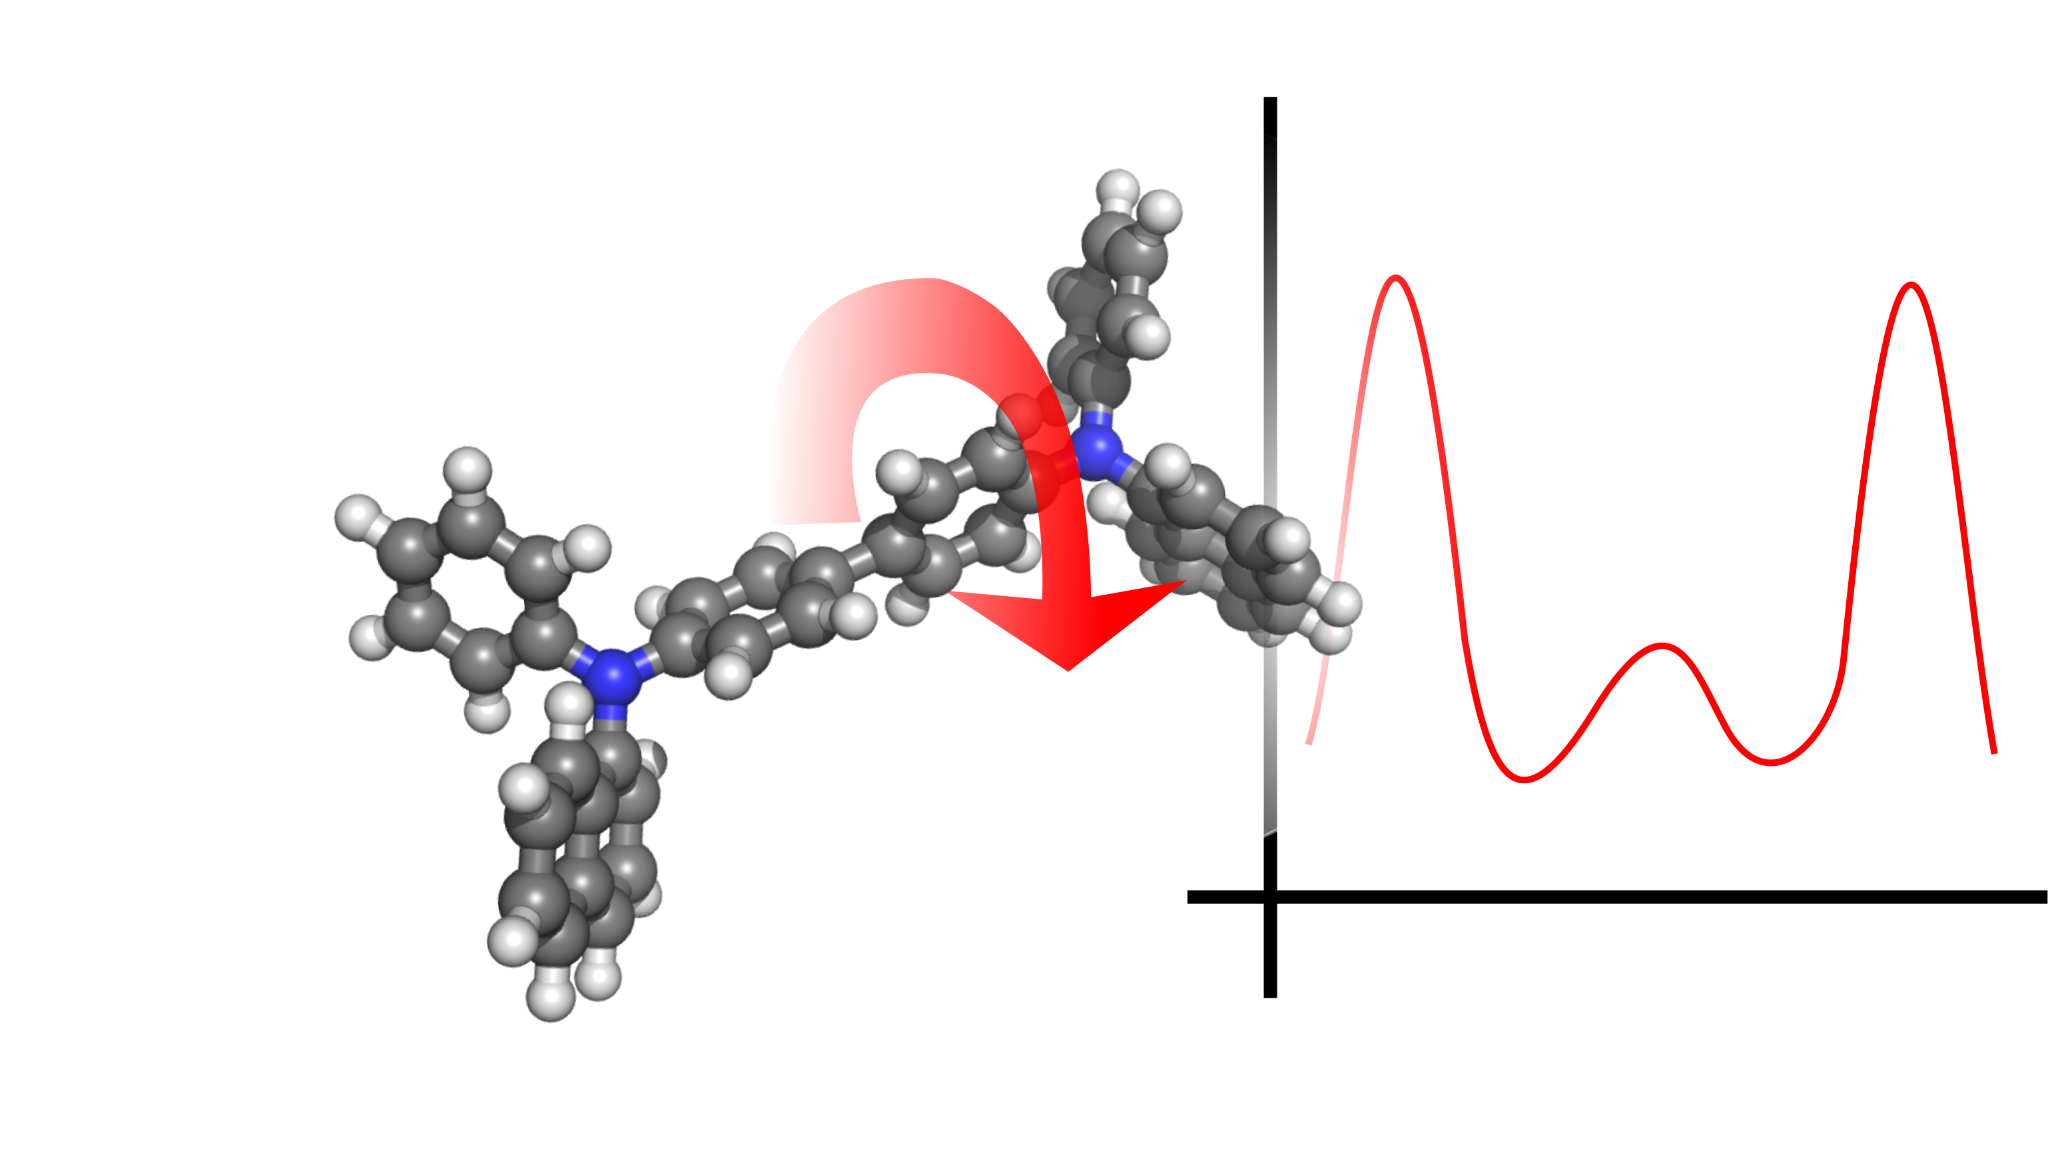
Computation of intramolecular
forcefields
|
|
|
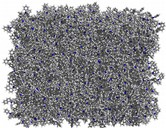
Simulation of the physical
vapor deposition (PVD)
to obtain atomistic morphology
|
|
|
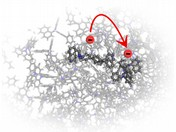
Calculation of electronic properties
including charge transfer parameters
|
|
|
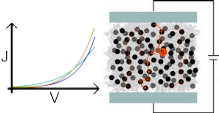
Simulation of charge-carrier transport
using kMC protocol
|
|
Implemented Scientific Methods
The following scientific methods are implemented in the Nanomatch Mobility Calculator:
Molecular Structure Optimization
obabel, xtb, and Density Functional Theory (DFT) are used to generate initial 3D conformers, pre-optimize and optimize the geometry, and compute partial charges via an electrostatic potential (ESP) fit for single molecules in a vacuum. DFT optimization is performed with def2-TZVP/B3LYP level of theory.
Morphology Generation
The DEPOSIT protocol [1] simulates physical vapor deposition to generate thin-film morphologies with atomistic resolution. This involves Monte Carlo (MC) based basin hopping with simulated annealing (SA) to model intermolecular interactions during deposition. In total, 1000 molecules are deposited into a box with a base size of 100x100 Å. After this, the top and bottom 7 Å are cut out, and periodic copies are added in the x and y axes to increase its base size to 300x300 Å.
Electronic Structure Calculation
Using the QuantumPatch method [2], energy disorder, electronic couplings, and reorganization energies are calculated by self-consistently equilibrating the charge densities of a subset of molecules in their unique environments. The shell structure is similar to those described in Keiser et al [3].
In total, 200 molecules core molecules are considered, embedded in the generated morphology. For these 200 molecules the following is computed:
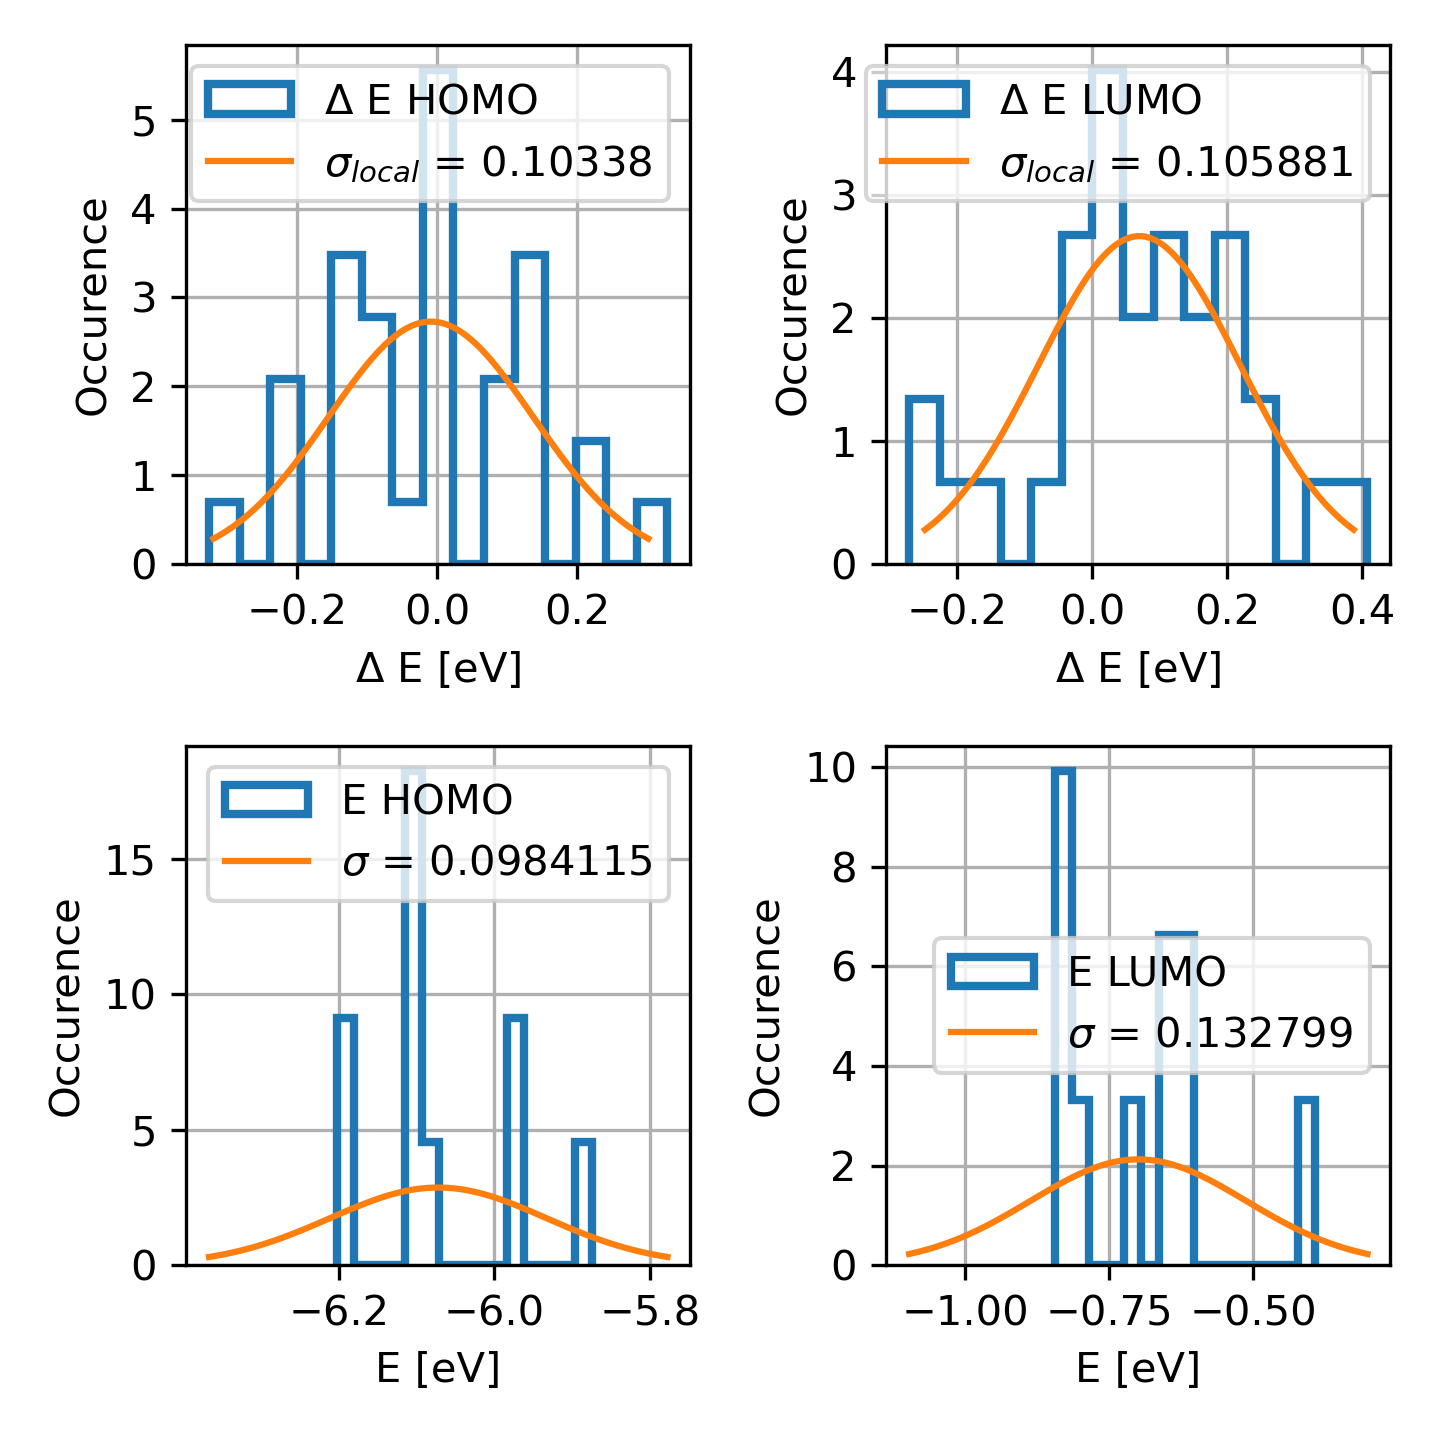
HOMO/LUMO levels of the embedded molecules, are self-consistently computed to yield the energy disorder, and their interactions are used to compute the overlap integral distribution across relevant distances.
Electronic couplings for every pair of 200 molecules if their distance is below a reasonable threshold.
From HOMO/LUMO distributions, the energy disorder is deduced.
The parameters of the QuantumPatch embedding scheme is as follows:
Core molecule: Self-consistent DFT def2-SVP/B3LYP
First shell: Self-consistent DFT shell def2-SVP/BP86, radius 15 Å
Second shell: Self-consistent DFTB, radius 25 Å
Third shell: Static DFTB, radius 60 Å
Structure Expansion
To bridge the scales from atomistic resolution to the device level, a stochastic expansion scheme EDCM is used to expand the thin-film morphologies to the size of 40x40x40 nm3, drawing electronic couplings and site energies from distributions analyzed in the QuantumPatch method.
Charge Transport Simulation
Kinetic Monte Carlo (kMC) simulations model charge transport in organic semiconductor thin films. The workflow uses the LightForge package to simulate field-dependent mobility, taking into account percolation and many-body effects [4]. Zero-field mobility is extrapolated to the zero-field limit assuming Poole-Frenkel field dependence.
Parameters of the kMC simulations:
Fields: three fields are applied: 0.02 0.03 0.04 eV/nm.
Morphology and replicas: for every field value, 10 independent morphologies are generated using the stochastic expansion scheme, including HOMO/LUMO/Js distributions derived from the QuantumPatch simulations.
Temperature is 300 K.
Convergence criterion: either the fluctuation parameter “iv_fluctuation” below 0.05, or “max_iterations” exceeds 5x10⁶.
Number of Charge Carriers: 30. In the expanded simulation box of 40x40x40 nm3, this results in a charge carrier concentration of 4.69x10¹⁷ charges per cm3.
Output
Displayed Results
The data below will be displayed as the workflow ends (backend name: result.yml):
ZUOUZKKEUPVFJK-UHFFFAOYSA-N:
  HOMO:
    value: -6.304540838835274
  LUMO:
    value: -0.9858224534777202
  dipole:
    results:
      dipole_vector:
      - -1.3524802844422331e-05
      - 3.1223022592016277e-06
      - 1.662349335263646e-05
    value: 2.1656629345848317e-05
  electron_mobility:
    results:
      fields:
        units: V/nm
        values:
        - 0.2
        - 0.3
        - 0.4
      mobilities:
        units: cm2/V*s
        values:
        - 0.12812247595879594
        - 0.40451844574738705
        - 0.6373425148883705
      stderr:
        units: cm2/V*s
        values:
        - 0.006634144943223338
        - 0.021912012246805144
        - 0.020222231531951042
    value: 0.0027914965621533006
  hole_mobility:
    results:
      fields:
        units: V/nm
        values:
        - 0.2
        - 0.3
        - 0.4
      mobilities:
        units: cm2/V*s
        values:
        - 0.023268197326548744
        - 0.05054069044778844
        - 0.08097590708969137
      stderr:
        units: cm2/V*s
        values:
        - 0.0013433181652565155
        - 0.003181913338943169
        - 0.0027155426204215098
    value: 0.0011653218988067668
  morphology:
    results:
      average_neighbors:
        unit: Angstrom
        value: 17.6
      mass_density:
        std: 0.01
        unit: g/cm3
        value: 1.14
      molecular_volume:
        unit: nm3
        value: 0.23
      number_density:
        std: 9.9e+19
        unit: 1/cm3
        value: 4.36e+21
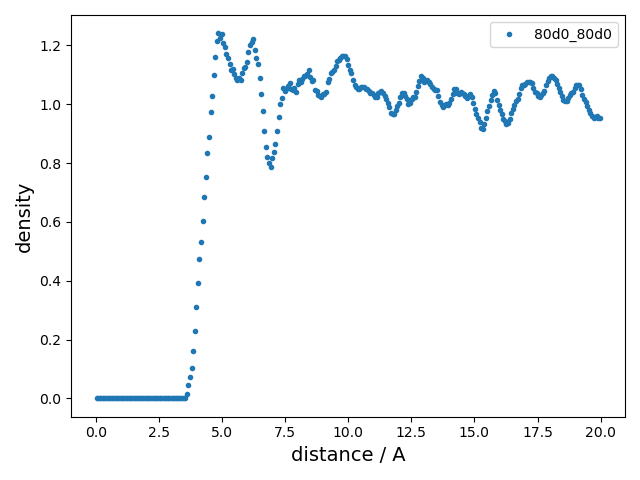
      rdf_first_peak:
        unit: Angstrom
        value: 4.921630094043887
    value: 'file: structure.cml'
The hole and electron zero-field mobilities (in [cm2/V*s]) are:
result['ZUOUZKKEUPVFJK-UHFFFAOYSA-N']['hole_mobility']['value']
result['ZUOUZKKEUPVFJK-UHFFFAOYSA-N']['electron_mobility']['value']
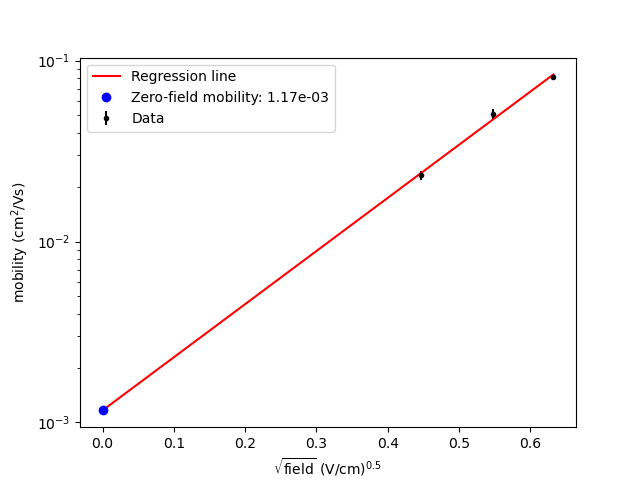
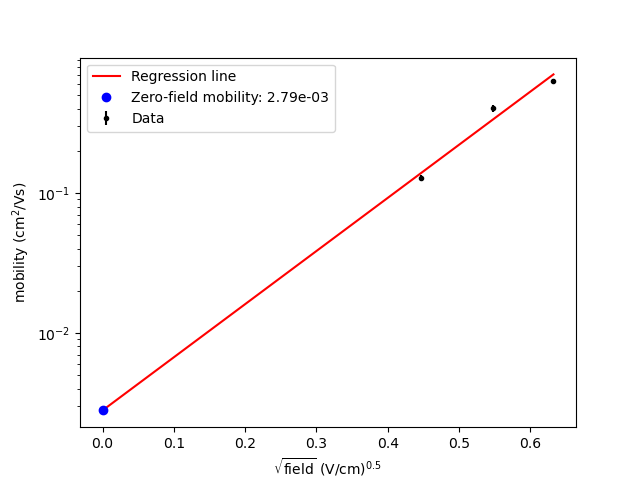
The value is derived from field-dependent mobilities, which are also provided in the output. Extrapolation is performed using linear regression in the log(mobility) vs. sqrt(field) plot. The extrapolation is shown in one of the output files, example: mobility_vs_sqrt_field.png.

Files
In addition to parsed output, the following files are available upon the workflow completion:
No. |
File |
Description |
Example |
|---|---|---|---|
1 |
DeltaE.png |
Distribution of the HOMO/LUMO
levels, local and global,
values of computed disorder.
|
|
2 |
output_molecule.mol2 |
Molecule output file in MOL2
format.
|
|
3 |
summary_RDF.png |
Radial distribution function
(RDF).
|
|
4 |
hole_mobility
_vs_sqrt_field.png
|
Poole-Frenkel plot of the
hole mobility versus the
square root of the
electric field.
|
|
5 |
electron_mobility
_vs_sqrt_field.png
|
Poole-Frenkel plot of the
electron mobility versus the
square root of the
electric field.
|
|
6 |
structure.cml |
Molecular structure in
CML format.
|
|
7 |
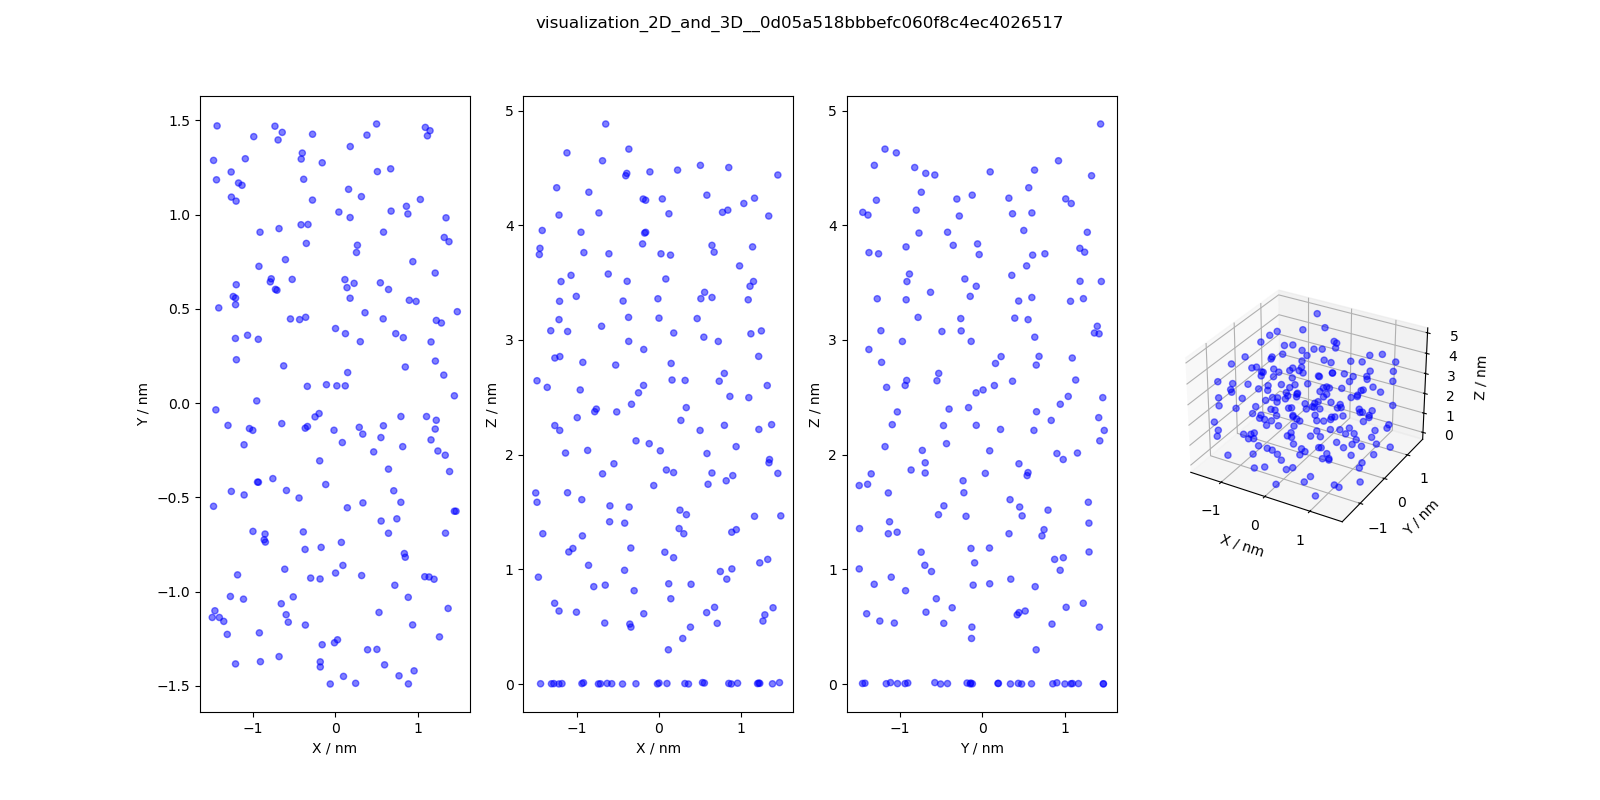
visualization_2D
_and_3D.png
|
2D and 3D visualizations
of the molecules
(center of geometries)
|
|
Benchmark
Benchmark set
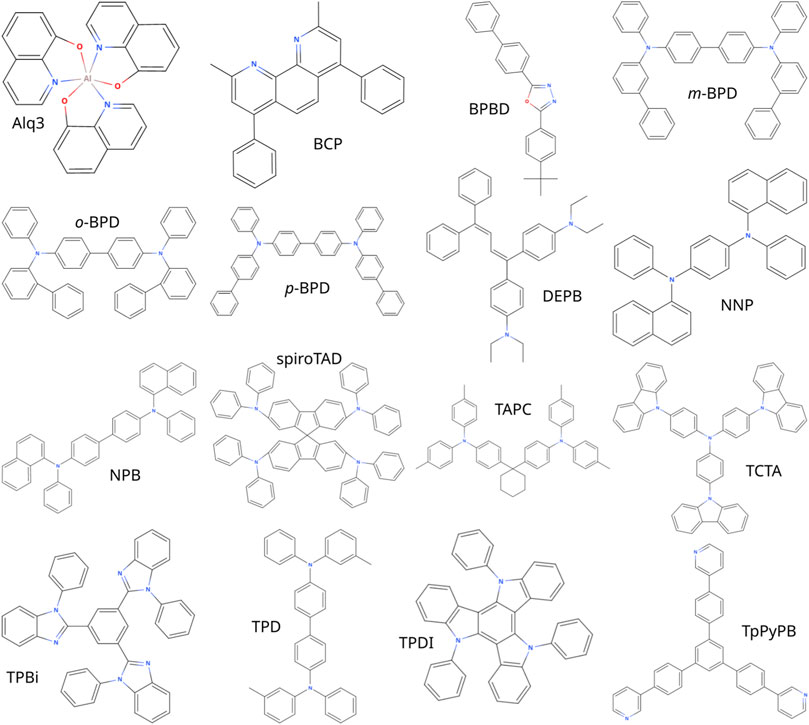
The benchmark of the mobility workflow was performed against experimentally measured mobility of the materials consisting of the following molecules [3].
Experimental verification
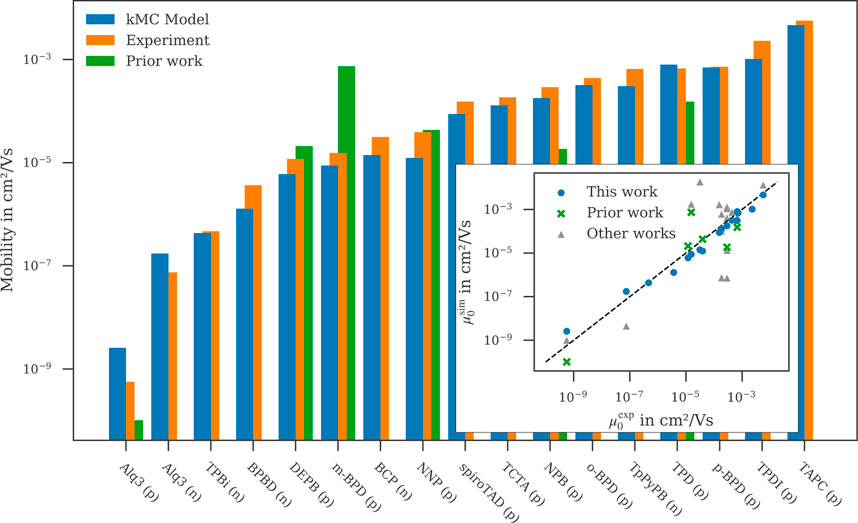
Excellent correlation with experimental data is observed for overwhelming majority of materials [3]:
Superiority wrt Other Works
The table below compares simulated zero-field mobilities and material properties using present workflow to other theoretical works as reported in Keiser et al. [3] to prior works.
Molecule |
σ/meV |
〈J²r²〉/eV² Ų |
λ/meV |
µ₀/cm² V⁻¹ s⁻¹ |
Source |
|---|---|---|---|---|---|
Alq3p |
199 |
1.0 × 10⁻² |
195 |
2.6 × 10⁻⁹ |
SK |
224 |
1.0 × 10⁻² |
296 |
1.0 × 10⁻¹⁰ |
PF |
|
Alq3n |
182 |
8.6 × 10⁻³ |
215 |
1.7 × 10⁻⁷ |
SK |
TPBin |
164 |
2.5 × 10⁻³ |
317 |
4.3 × 10⁻⁷ |
SK |
BPBDn |
182 |
5.2 × 10⁻³ |
291 |
1.3 × 10⁻⁶ |
SK |
DEPBp |
133 |
2.4 × 10⁻³ |
316 |
6.0 × 10⁻⁶ |
SK |
130 |
1.4 × 10⁻³ |
266 |
2.1 × 10⁻⁵ |
PF |
|
m-BPDp |
132 |
1.6 × 10⁻³ |
210 |
8.8 × 10⁻⁶ |
SK |
110 |
1.5 × 10⁻³ |
143 |
7.4 × 10⁻⁴ |
PF |
|
300 |
1.7 × 10⁻³ |
DE |
|||
BCPn |
139 |
3.2 × 10⁻³ |
314 |
1.4 × 10⁻⁵ |
SK |
1.8 × 10⁻² |
PK |
||||
NNPp |
124 |
1.6 × 10⁻³ |
281 |
1.2 × 10⁻⁵ |
SK |
135 |
1.6 × 10⁻³ |
160 |
4.3 × 10⁻⁵ |
PF |
|
spiroTADp |
105 |
1.7 × 10⁻³ |
139 |
8.7 × 10⁻⁵ |
SK |
90 |
250 |
1.6 × 10⁻³ |
NK |
||
TCTAp |
107 |
1.7 × 10⁻³ |
206 |
1.3 × 10⁻⁴ |
SK |
136 |
257 |
7.2 × 10⁻⁷ |
AM |
||
112 |
260 |
1.0 × 10⁻⁴ |
NK |
||
290 |
5.9 × 10⁻⁴ |
DE |
|||
NPBp |
104 |
1.4 × 10⁻³ |
205 |
1.8 × 10⁻⁴ |
SK |
130 |
203 |
6.9 × 10⁻⁷ |
AM |
||
114 |
1.3 × 10⁻⁵ |
PK |
|||
144 |
2.0 × 10⁻³ |
158 |
1.8 × 10⁻⁵ |
PF |
|
87 |
310 |
1.1 × 10⁻³ |
NK |
||
280 |
1.3 × 10⁻³ |
DE |
|||
o-BPDp |
96 |
1.8 × 10⁻³ |
213 |
3.2 × 10⁻⁴ |
SK |
310 |
7.2 × 10⁻⁴ |
DE |
|||
TpPyPBn |
123 |
6.4 × 10⁻³ |
200 |
3.0 × 10⁻⁴ |
SK |
TPDp |
96 |
1.7 × 10⁻³ |
208 |
7.9 × 10⁻⁴ |
SK |
129 |
1.6 × 10⁻³ |
110 |
1.5 × 10⁻⁴ |
PF |
|
310 |
8.3 × 10⁻⁴ |
DE |
|||
p-BPDp |
94 |
1.3 × 10⁻³ |
173 |
7.0 × 10⁻⁴ |
SK |
230 |
3.8 × 10⁻⁴ |
DE |
|||
TPDIp |
82 |
4.8 × 10⁻³ |
145 |
1.0 × 10⁻³ |
SK |
TAPCp |
74 |
1.4 × 10⁻³ |
89 |
4.6 × 10⁻³ |
SK |
Abbreviations
SK: Nanomatch Mobility Worflow (Keiser, S. et al., 2021 [3])
AF: A. Fuchs et al. (2012), “Molecular origin of differences in hole and electron mobility in amorphous Alq₃—a multiscale simulation study,” Phys. Chem. Chem. Phys., 14, 4259-4270. URL: https://doi.org/10.1039/C2CP23489K
GA: G. Aydin and I. Yavuz (2021), “Intrinsic Static/Dynamic Energetic Disorders of Amorphous Organic Semiconductors: Microscopic Simulations and Device Study,” J. Phys. Chem. C, 125, 6862–6869. URL: https://doi.org/10.1021/acs.jpcc.0c11219
PK: P. Kordt et al. (2015), “Modeling of Organic Light Emitting Diodes: From Molecular to Device Properties,” Adv. Funct. Mater., 25, 1955-1971. URL: https://doi.org/10.1002/adfm.201403004
AM: A. Massé et al. (2016), “Ab initio charge-carrier mobility model for amorphous molecular semiconductors,” Phys. Rev. B, 93, 195209. URL: https://doi.org/10.1103/PhysRevB.93.195209
DE: D. Evans et al. (2016), “Estimation of charge carrier mobility in amorphous organic materials using percolation corrected random-walk model,” Org. Electron., 29, 50–56. URL: https://doi.org/10.1016/j.orgel.2015.11.021
PF: P. Friederich et al. (2016), “Molecular Origin of the Charge Carrier Mobility in Small Molecule Organic Semiconductors,” Adv. Funct. Mater., 26, 5757–5763. URL: https://doi.org/10.1002/adfm.201601807
NK: N. Kotadiya et al. (2018), “Rigorous Characterization and Predictive Modeling of Hole Transport in Amorphous Organic Semiconductors,” Adv. Electron. Mater., 4, 1800366. URL: https://doi.org/10.1002/aelm.201800366